Raster Layers
Close a raster dataset
This recipe shows how to close a raster dataset. It is useful in the middle of a script, to recover the resources held by accessing the dataset, remove file locks, etc. It is not necessary at the end of the script, as the Python garbage collector will do the same thing automatically when the script exits. Further discussion of this topic can be found in this GIS StackExchange question.
import gdal

# open dataset
ds = gdal.Open('test.tif')

# close dataset
ds = None
Get Raster Metadata
Get raster metadata for quick-and-dirty resolution checks
from osgeo import gdal
gtif = gdal.Open( "INPUT.tif" )
print gtif.GetMetadata()
Get Raster Band
Get a raster band. Notice how we are handling runtime errors this function might throw.
from osgeo import gdal
import sys
# this allows GDAL to throw Python Exceptions
gdal.UseExceptions()

try:
    src_ds = gdal.Open( "INPUT.tif" )
except RuntimeError, e:
    print 'Unable to open INPUT.tif'
    print e
    sys.exit(1)

try:
    srcband = src_ds.GetRasterBand(1)
except RuntimeError, e:
    # for example, try GetRasterBand(10)
    print 'Band ( %i ) not found' % band_num
    print e
    sys.exit(1)
Loop Through All Raster Bands
Loop through all raster bands and do something useful like listing band statistics.
from osgeo import gdal
import sys

src_ds = gdal.Open( "INPUT.tif" )
if src_ds is None:
    print 'Unable to open INPUT.tif'
    sys.exit(1)

print "[ RASTER BAND COUNT ]: ", src_ds.RasterCount
for band in range( src_ds.RasterCount ):
    band += 1
    print "[ GETTING BAND ]: ", band
    srcband = src_ds.GetRasterBand(band)
    if srcband is None:
        continue

    stats = srcband.GetStatistics( True, True )
    if stats is None:
        continue

    print "[ STATS ] =  Minimum=%.3f, Maximum=%.3f, Mean=%.3f, StdDev=%.3f" % ( \
                stats[0], stats[1], stats[2], stats[3] )
Get Raster Band Information
Using the documentation on the Band API we can write a script that dumps out single band information
from osgeo import gdal
import sys
gdal.UseExceptions()

def Usage():
    print("""
    $ getrasterband.py [ band number ] input-raster
    """)
    sys.exit(1)

def main( band_num, input_file ):
    src_ds = gdal.Open( input_file )
    if src_ds is None:
        print 'Unable to open %s' % input_file
        sys.exit(1)

    try:
        srcband = src_ds.GetRasterBand(band_num)
    except RuntimeError, e:
        print 'No band %i found' % band_num
        print e
        sys.exit(1)


    print "[ NO DATA VALUE ] = ", srcband.GetNoDataValue()
    print "[ MIN ] = ", srcband.GetMinimum()
    print "[ MAX ] = ", srcband.GetMaximum()
    print "[ SCALE ] = ", srcband.GetScale()
    print "[ UNIT TYPE ] = ", srcband.GetUnitType()
    ctable = srcband.GetColorTable()

    if ctable is None:
        print 'No ColorTable found'
        sys.exit(1)

    print "[ COLOR TABLE COUNT ] = ", ctable.GetCount()
    for i in range( 0, ctable.GetCount() ):
        entry = ctable.GetColorEntry( i )
        if not entry:
            continue
        print "[ COLOR ENTRY RGB ] = ", ctable.GetColorEntryAsRGB( i, entry )

if __name__ == '__main__':

    if len( sys.argv ) < 3:
        print """
        [ ERROR ] you must supply at least two arguments:
        1) the band number to retrieve and 2) input raster
        """
        Usage()

    main( int(sys.argv[1]), sys.argv[2] )
Polygonize a Raster Band
Turn a single raster band into a vector polygon!
If you haven’t before, notice that some of the gdal utilties are actually Python scripts. Go find them on your computer, read the source code and mine them for API tricks. It turns out the gdal_polygonize utility just wraps a call to GDALFPolygonize so writing your own hacky polygonize Python script is pretty easy.
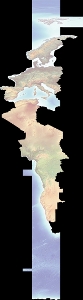
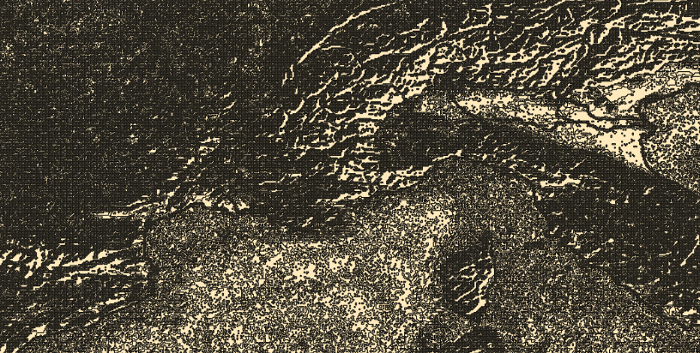
The raster we are going to polygonize:
from osgeo import gdal, ogr
import sys
# this allows GDAL to throw Python Exceptions
gdal.UseExceptions()

#
#  get raster datasource
#
src_ds = gdal.Open( "INPUT.tif" )
if src_ds is None:
    print 'Unable to open %s' % src_filename
    sys.exit(1)

try:
    srcband = src_ds.GetRasterBand(3)
except RuntimeError, e:
    # for example, try GetRasterBand(10)
    print 'Band ( %i ) not found' % band_num
    print e
    sys.exit(1)

#
#  create output datasource
#
dst_layername = "POLYGONIZED_STUFF"
drv = ogr.GetDriverByName("ESRI Shapefile")
dst_ds = drv.CreateDataSource( dst_layername + ".shp" )
dst_layer = dst_ds.CreateLayer(dst_layername, srs = None )

gdal.Polygonize( srcband, None, dst_layer, -1, [], callback=None )
A closeup of the vector output – this is northern Italy:
Convert an OGR File to a Raster
This recipe takes in a OGR file (e.g. shapefile) and creates a new raster Tiff file based on the shapefile.
from osgeo import gdal, ogr

# Define pixel_size and NoData value of new raster
pixel_size = 25
NoData_value = -9999

# Filename of input OGR file
vector_fn = 'test.shp'

# Filename of the raster Tiff that will be created
raster_fn = 'test.tif'

# Open the data source and read in the extent
source_ds = ogr.Open(vector_fn)
source_layer = source_ds.GetLayer()
x_min, x_max, y_min, y_max = source_layer.GetExtent()

# Create the destination data source
x_res = int((x_max - x_min) / pixel_size)
y_res = int((y_max - y_min) / pixel_size)
target_ds = gdal.GetDriverByName('GTiff').Create(raster_fn, x_res, y_res, 1, gdal.GDT_Byte)
target_ds.SetGeoTransform((x_min, pixel_size, 0, y_max, 0, -pixel_size))
band = target_ds.GetRasterBand(1)
band.SetNoDataValue(NoData_value)

# Rasterize
gdal.RasterizeLayer(target_ds, [1], source_layer, burn_values=[0])
Clip a GeoTiff with Shapefile
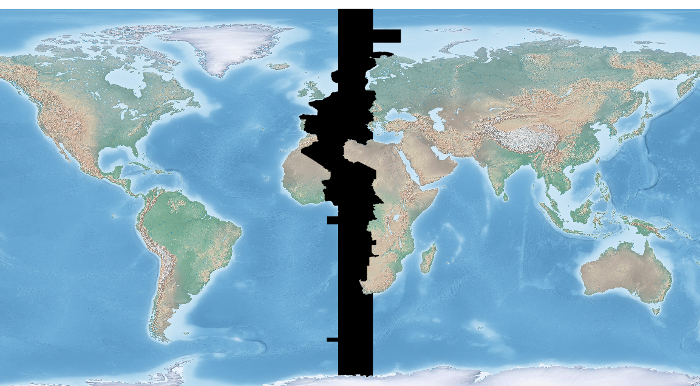
Let’s use some Natural Earth data and clip a 10m relief geotiff with the Europe/Paris timezone polygon. Most of the following workflow came from this geospatialpython post . However, the source code on that site assumes your clipping polygon is the same extent as the input geotiff. If it is not, then your clipped geotiff will take the input geotiff’s extent, which will be incorrect. The modified script below takes this into account and sets the correct x,y offsets for the clipped geotiff. Note, in the following example we are assuming you have the Python Imaging Library installed.
Before Image: the input Natural Earth 10m geotiff with the timezone overlay we want to clip out:
from osgeo import gdal, gdalnumeric, ogr, osr
import Image, ImageDraw
import os, sys
gdal.UseExceptions()


# This function will convert the rasterized clipper shapefile
# to a mask for use within GDAL.
def imageToArray(i):
    """
    Converts a Python Imaging Library array to a
    gdalnumeric image.
    """
    a=gdalnumeric.fromstring(i.tostring(),'b')
    a.shape=i.im.size[1], i.im.size[0]
    return a

def arrayToImage(a):
    """
    Converts a gdalnumeric array to a
    Python Imaging Library Image.
    """
    i=Image.fromstring('L',(a.shape[1],a.shape[0]),
            (a.astype('b')).tostring())
    return i

def world2Pixel(geoMatrix, x, y):
  """
  Uses a gdal geomatrix (gdal.GetGeoTransform()) to calculate
  the pixel location of a geospatial coordinate
  """
  ulX = geoMatrix[0]
  ulY = geoMatrix[3]
  xDist = geoMatrix[1]
  yDist = geoMatrix[5]
  rtnX = geoMatrix[2]
  rtnY = geoMatrix[4]
  pixel = int((x - ulX) / xDist)
  line = int((ulY - y) / xDist)
  return (pixel, line)

#
#  EDIT: this is basically an overloaded
#  version of the gdal_array.OpenArray passing in xoff, yoff explicitly
#  so we can pass these params off to CopyDatasetInfo
#
def OpenArray( array, prototype_ds = None, xoff=0, yoff=0 ):
    ds = gdal.Open( gdalnumeric.GetArrayFilename(array) )

    if ds is not None and prototype_ds is not None:
        if type(prototype_ds).__name__ == 'str':
            prototype_ds = gdal.Open( prototype_ds )
        if prototype_ds is not None:
            gdalnumeric.CopyDatasetInfo( prototype_ds, ds, xoff=xoff, yoff=yoff )
    return ds

def histogram(a, bins=range(0,256)):
  """
  Histogram function for multi-dimensional array.
  a = array
  bins = range of numbers to match
  """
  fa = a.flat
  n = gdalnumeric.searchsorted(gdalnumeric.sort(fa), bins)
  n = gdalnumeric.concatenate([n, [len(fa)]])
  hist = n[1:]-n[:-1]
  return hist

def stretch(a):
  """
  Performs a histogram stretch on a gdalnumeric array image.
  """
  hist = histogram(a)
  im = arrayToImage(a)
  lut = []
  for b in range(0, len(hist), 256):
    # step size
    step = reduce(operator.add, hist[b:b+256]) / 255
    # create equalization lookup table
    n = 0
    for i in range(256):
      lut.append(n / step)
      n = n + hist[i+b]
  im = im.point(lut)
  return imageToArray(im)

def main( shapefile_path, raster_path ):
    # Load the source data as a gdalnumeric array
    srcArray = gdalnumeric.LoadFile(raster_path)

    # Also load as a gdal image to get geotransform
    # (world file) info
    srcImage = gdal.Open(raster_path)
    geoTrans = srcImage.GetGeoTransform()

    # Create an OGR layer from a boundary shapefile
    shapef = ogr.Open(shapefile_path)
    lyr = shapef.GetLayer( os.path.split( os.path.splitext( shapefile_path )[0] )[1] )
    poly = lyr.GetNextFeature()

    # Convert the layer extent to image pixel coordinates
    minX, maxX, minY, maxY = lyr.GetExtent()
    ulX, ulY = world2Pixel(geoTrans, minX, maxY)
    lrX, lrY = world2Pixel(geoTrans, maxX, minY)

    # Calculate the pixel size of the new image
    pxWidth = int(lrX - ulX)
    pxHeight = int(lrY - ulY)

    clip = srcArray[:, ulY:lrY, ulX:lrX]

    #
    # EDIT: create pixel offset to pass to new image Projection info
    #
    xoffset =  ulX
    yoffset =  ulY
    print "Xoffset, Yoffset = ( %f, %f )" % ( xoffset, yoffset )

    # Create a new geomatrix for the image
    geoTrans = list(geoTrans)
    geoTrans[0] = minX
    geoTrans[3] = maxY

    # Map points to pixels for drawing the
    # boundary on a blank 8-bit,
    # black and white, mask image.
    points = []
    pixels = []
    geom = poly.GetGeometryRef()
    pts = geom.GetGeometryRef(0)
    for p in range(pts.GetPointCount()):
      points.append((pts.GetX(p), pts.GetY(p)))
    for p in points:
      pixels.append(world2Pixel(geoTrans, p[0], p[1]))
    rasterPoly = Image.new("L", (pxWidth, pxHeight), 1)
    rasterize = ImageDraw.Draw(rasterPoly)
    rasterize.polygon(pixels, 0)
    mask = imageToArray(rasterPoly)

    # Clip the image using the mask
    clip = gdalnumeric.choose(mask, \
        (clip, 0)).astype(gdalnumeric.uint8)

    # This image has 3 bands so we stretch each one to make them
    # visually brighter
    for i in range(3):
      clip[i,:,:] = stretch(clip[i,:,:])

    # Save new tiff
    #
    #  EDIT: instead of SaveArray, let's break all the
    #  SaveArray steps out more explicity so
    #  we can overwrite the offset of the destination
    #  raster
    #
    ### the old way using SaveArray
    #
    # gdalnumeric.SaveArray(clip, "OUTPUT.tif", format="GTiff", prototype=raster_path)
    #
    ###
    #
    gtiffDriver = gdal.GetDriverByName( 'GTiff' )
    if gtiffDriver is None:
        raise ValueError("Can't find GeoTiff Driver")
    gtiffDriver.CreateCopy( "OUTPUT.tif",
        OpenArray( clip, prototype_ds=raster_path, xoff=xoffset, yoff=yoffset )
    )

    # Save as an 8-bit jpeg for an easy, quick preview
    clip = clip.astype(gdalnumeric.uint8)
    gdalnumeric.SaveArray(clip, "OUTPUT.jpg", format="JPEG")

    gdal.ErrorReset()


if __name__ == '__main__':

    #
    # example run : $ python clip.py /<full-path>/<shapefile-name>.shp /<full-path>/<raster-name>.tif
    #
    if len( sys.argv ) < 2:
        print "[ ERROR ] you must two args. 1) the full shapefile path and 2) the full raster path"
        sys.exit( 1 )

    main( sys.argv[1], sys.argv[2] )
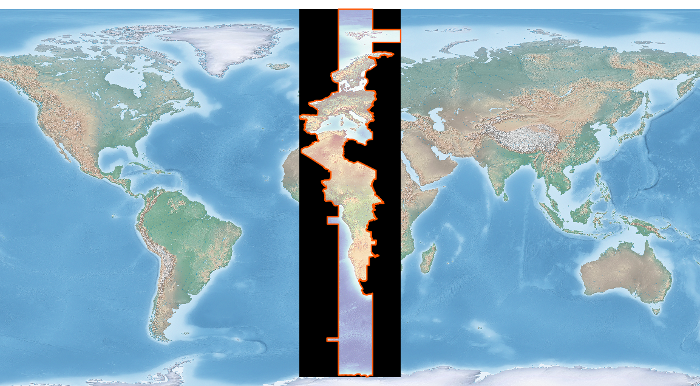
After Image: the clipped geotiff with the timezone border overlayed in orange on top of input geotiff:
Calculate zonal statistics
This recipe calculates statistics on values of a raster within the zones of a vector dataset. It returns for each feature a dictionary item (FID) with the statistical values in the following order: Average, Mean, Medain, Standard Deviation, Variance
While this recipe works and is a good example, it is generally recommended to use [rasterstats](https://github.com/perrygeo/python-raster-stats) for calculating zonal statistics with Python.
import gdal, ogr, osr, numpy
import sys


def zonal_stats(feat, input_zone_polygon, input_value_raster):

    # Open data
    raster = gdal.Open(input_value_raster)
    shp = ogr.Open(input_zone_polygon)
    lyr = shp.GetLayer()

    # Get raster georeference info
    transform = raster.GetGeoTransform()
    xOrigin = transform[0]
    yOrigin = transform[3]
    pixelWidth = transform[1]
    pixelHeight = transform[5]

    # Reproject vector geometry to same projection as raster
    sourceSR = lyr.GetSpatialRef()
    targetSR = osr.SpatialReference()
    targetSR.ImportFromWkt(raster.GetProjectionRef())
    coordTrans = osr.CoordinateTransformation(sourceSR,targetSR)
    feat = lyr.GetNextFeature()
    geom = feat.GetGeometryRef()
    geom.Transform(coordTrans)

    # Get extent of feat
    geom = feat.GetGeometryRef()
    if (geom.GetGeometryName() == 'MULTIPOLYGON'):
        count = 0
        pointsX = []; pointsY = []
        for polygon in geom:
            geomInner = geom.GetGeometryRef(count)
            ring = geomInner.GetGeometryRef(0)
            numpoints = ring.GetPointCount()
            for p in range(numpoints):
                    lon, lat, z = ring.GetPoint(p)
                    pointsX.append(lon)
                    pointsY.append(lat)
            count += 1
    elif (geom.GetGeometryName() == 'POLYGON'):
        ring = geom.GetGeometryRef(0)
        numpoints = ring.GetPointCount()
        pointsX = []; pointsY = []
        for p in range(numpoints):
                lon, lat, z = ring.GetPoint(p)
                pointsX.append(lon)
                pointsY.append(lat)

    else:
        sys.exit("ERROR: Geometry needs to be either Polygon or Multipolygon")

    xmin = min(pointsX)
    xmax = max(pointsX)
    ymin = min(pointsY)
    ymax = max(pointsY)

    # Specify offset and rows and columns to read
    xoff = int((xmin - xOrigin)/pixelWidth)
    yoff = int((yOrigin - ymax)/pixelWidth)
    xcount = int((xmax - xmin)/pixelWidth)+1
    ycount = int((ymax - ymin)/pixelWidth)+1

    # Create memory target raster
    target_ds = gdal.GetDriverByName('MEM').Create('', xcount, ycount, 1, gdal.GDT_Byte)
    target_ds.SetGeoTransform((
        xmin, pixelWidth, 0,
        ymax, 0, pixelHeight,
    ))

    # Create for target raster the same projection as for the value raster
    raster_srs = osr.SpatialReference()
    raster_srs.ImportFromWkt(raster.GetProjectionRef())
    target_ds.SetProjection(raster_srs.ExportToWkt())

    # Rasterize zone polygon to raster
    gdal.RasterizeLayer(target_ds, [1], lyr, burn_values=[1])

    # Read raster as arrays
    banddataraster = raster.GetRasterBand(1)
    dataraster = banddataraster.ReadAsArray(xoff, yoff, xcount, ycount).astype(numpy.float)

    bandmask = target_ds.GetRasterBand(1)
    datamask = bandmask.ReadAsArray(0, 0, xcount, ycount).astype(numpy.float)

    # Mask zone of raster
    zoneraster = numpy.ma.masked_array(dataraster,  numpy.logical_not(datamask))

    # Calculate statistics of zonal raster
    return numpy.average(zoneraster),numpy.mean(zoneraster),numpy.median(zoneraster),numpy.std(zoneraster),numpy.var(zoneraster)


def loop_zonal_stats(input_zone_polygon, input_value_raster):

    shp = ogr.Open(input_zone_polygon)
    lyr = shp.GetLayer()
    featList = range(lyr.GetFeatureCount())
    statDict = {}

    for FID in featList:
        feat = lyr.GetFeature(FID)
        meanValue = zonal_stats(feat, input_zone_polygon, input_value_raster)
        statDict[FID] = meanValue
    return statDict

def main(input_zone_polygon, input_value_raster):
    return loop_zonal_stats(input_zone_polygon, input_value_raster)


if __name__ == "__main__":

    #
    # Returns for each feature a dictionary item (FID) with the statistical values in the following order: Average, Mean, Medain, Standard Deviation, Variance
    #
    # example run : $ python grid.py <full-path><output-shapefile-name>.shp xmin xmax ymin ymax gridHeight gridWidth
    #

    if len( sys.argv ) != 3:
        print "[ ERROR ] you must supply two arguments: input-zone-shapefile-name.shp input-value-raster-name.tif "
        sys.exit( 1 )
    print 'Returns for each feature a dictionary item (FID) with the statistical values in the following order: Average, Mean, Medain, Standard Deviation, Variance'
    print main( sys.argv[1], sys.argv[2] )
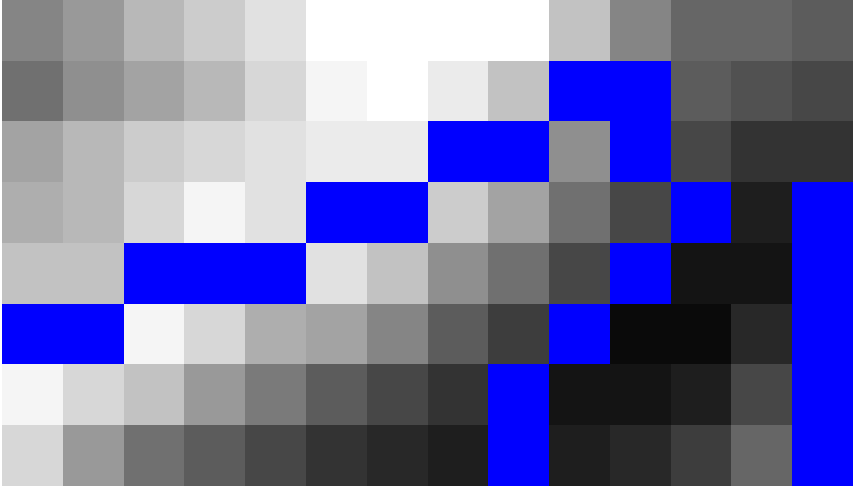
Raster to vector line
This recipe converts raster pixels with a specified value to vector lines. For example the blue pixels (value = 0) are converted to vector lines.
import ogr, gdal, osr, os
import numpy as np
import itertools
from math import sqrt,ceil

def pixelOffset2coord(rasterfn,xOffset,yOffset):
    raster = gdal.Open(rasterfn)
    geotransform = raster.GetGeoTransform()
    originX = geotransform[0]
    originY = geotransform[3]
    pixelWidth = geotransform[1]
    pixelHeight = geotransform[5]
    coordX = originX+pixelWidth*xOffset
    coordY = originY+pixelHeight*yOffset
    return coordX, coordY

def raster2array(rasterfn):
    raster = gdal.Open(rasterfn)
    band = raster.GetRasterBand(1)
    array = band.ReadAsArray()
    return array

def array2shp(array,outSHPfn,rasterfn,pixelValue):

    # max distance between points
    raster = gdal.Open(rasterfn)
    geotransform = raster.GetGeoTransform()
    pixelWidth = geotransform[1]
    maxDistance = ceil(sqrt(2*pixelWidth*pixelWidth))
    print maxDistance

    # array2dict
    count = 0
    roadList = np.where(array == pixelValue)
    multipoint = ogr.Geometry(ogr.wkbMultiLineString)
    pointDict = {}
    for indexY in roadList[0]:
        indexX = roadList[1][count]
        Xcoord, Ycoord = pixelOffset2coord(rasterfn,indexX,indexY)
        pointDict[count] = (Xcoord, Ycoord)
        count += 1

    # dict2wkbMultiLineString
    multiline = ogr.Geometry(ogr.wkbMultiLineString)
    for i in itertools.combinations(pointDict.values(), 2):
        point1 = ogr.Geometry(ogr.wkbPoint)
        point1.AddPoint(i[0][0],i[0][1])
        point2 = ogr.Geometry(ogr.wkbPoint)
        point2.AddPoint(i[1][0],i[1][1])

        distance = point1.Distance(point2)

        if distance < maxDistance:
            line = ogr.Geometry(ogr.wkbLineString)
            line.AddPoint(i[0][0],i[0][1])
            line.AddPoint(i[1][0],i[1][1])
            multiline.AddGeometry(line)

    # wkbMultiLineString2shp
    shpDriver = ogr.GetDriverByName("ESRI Shapefile")
    if os.path.exists(outSHPfn):
        shpDriver.DeleteDataSource(outSHPfn)
    outDataSource = shpDriver.CreateDataSource(outSHPfn)
    outLayer = outDataSource.CreateLayer(outSHPfn, geom_type=ogr.wkbMultiLineString )
    featureDefn = outLayer.GetLayerDefn()
    outFeature = ogr.Feature(featureDefn)
    outFeature.SetGeometry(multiline)
    outLayer.CreateFeature(outFeature)


def main(rasterfn,outSHPfn,pixelValue):
    array = raster2array(rasterfn)
    array2shp(array,outSHPfn,rasterfn,pixelValue)

if __name__ == "__main__":
    rasterfn = 'test.tif'
    outSHPfn = 'test.shp'
    pixelValue = 0
    main(rasterfn,outSHPfn,pixelValue)
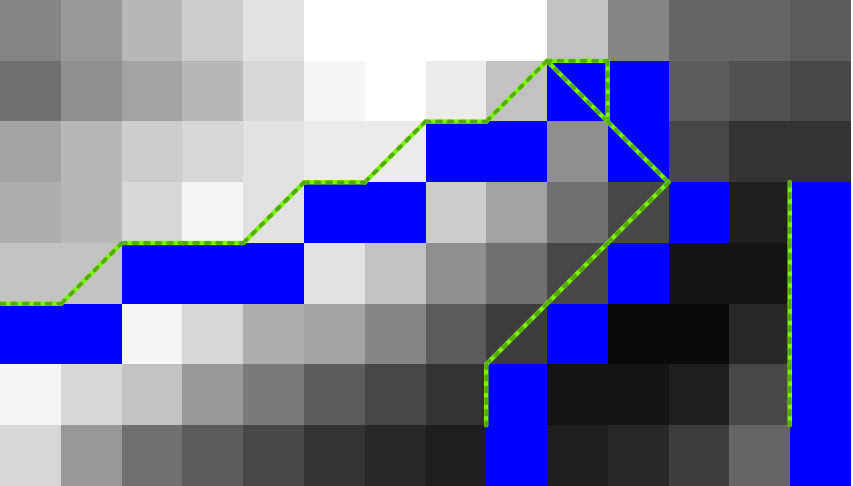
The green lines show the converted lines.
Create raster from array
This recipe creates a raster from an array
import gdal, ogr, os, osr
import numpy as np


def array2raster(newRasterfn,rasterOrigin,pixelWidth,pixelHeight,array):

    cols = array.shape[1]
    rows = array.shape[0]
    originX = rasterOrigin[0]
    originY = rasterOrigin[1]

    driver = gdal.GetDriverByName('GTiff')
    outRaster = driver.Create(newRasterfn, cols, rows, 1, gdal.GDT_Byte)
    outRaster.SetGeoTransform((originX, pixelWidth, 0, originY, 0, pixelHeight))
    outband = outRaster.GetRasterBand(1)
    outband.WriteArray(array)
    outRasterSRS = osr.SpatialReference()
    outRasterSRS.ImportFromEPSG(4326)
    outRaster.SetProjection(outRasterSRS.ExportToWkt())
    outband.FlushCache()


def main(newRasterfn,rasterOrigin,pixelWidth,pixelHeight,array):
    reversed_arr = array[::-1] # reverse array so the tif looks like the array
    array2raster(newRasterfn,rasterOrigin,pixelWidth,pixelHeight,reversed_arr) # convert array to raster


if __name__ == "__main__":
    rasterOrigin = (-123.25745,45.43013)
    pixelWidth = 10
    pixelHeight = 10
    newRasterfn = 'test.tif'
    array = np.array([[ 1, 1, 1, 1, 1, 1, 1, 1, 1, 1, 1, 1, 1, 1, 1, 1, 1, 1, 1],
                      [ 1, 1, 1, 1, 1, 1, 1, 1, 1, 1, 1, 1, 1, 1, 1, 1, 1, 1, 1],
                      [ 1, 0, 0, 0, 0, 1, 0, 0, 0, 0, 1, 0, 0, 0, 1, 0, 1, 1, 1],
                      [ 1, 0, 1, 1, 1, 1, 1, 0, 1, 0, 1, 0, 1, 0, 1, 0, 1, 1, 1],
                      [ 1, 0, 1, 0, 0, 1, 1, 0, 1, 0, 1, 0, 0, 0, 1, 0, 1, 1, 1],
                      [ 1, 0, 1, 1, 0, 1, 1, 0, 1, 0, 1, 0, 1, 0, 1, 0, 1, 1, 1],
                      [ 1, 0, 0, 0, 0, 1, 0, 0, 0, 0, 1, 0, 1, 0, 1, 0, 0, 0, 1],
                      [ 1, 1, 1, 1, 1, 1, 1, 1, 1, 1, 1, 1, 1, 1, 1, 1, 1, 1, 1],
                      [ 1, 1, 1, 1, 1, 1, 1, 1, 1, 1, 1, 1, 1, 1, 1, 1, 1, 1, 1],
                      [ 1, 1, 1, 1, 1, 1, 1, 1, 1, 1, 1, 1, 1, 1, 1, 1, 1, 1, 1]])


    main(newRasterfn,rasterOrigin,pixelWidth,pixelHeight,array)
The create raster from the example array looks like this:

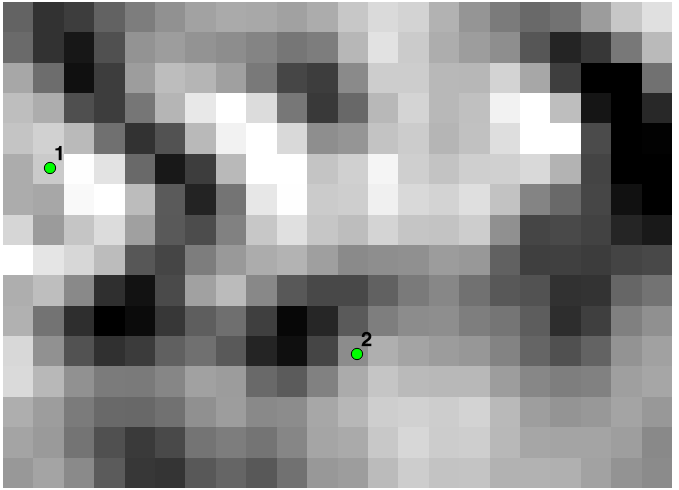
Create least cost path
This recipe creates a least cost path between two coordinates based on a raster cost surface. In the example below, a cost path between point 1 and point 2 is created based on a slope raster.
import gdal, osr
from skimage.graph import route_through_array
import numpy as np


def raster2array(rasterfn):
    raster = gdal.Open(rasterfn)
    band = raster.GetRasterBand(1)
    array = band.ReadAsArray()
    return array

def coord2pixelOffset(rasterfn,x,y):
    raster = gdal.Open(rasterfn)
    geotransform = raster.GetGeoTransform()
    originX = geotransform[0]
    originY = geotransform[3]
    pixelWidth = geotransform[1]
    pixelHeight = geotransform[5]
    xOffset = int((x - originX)/pixelWidth)
    yOffset = int((y - originY)/pixelHeight)
    return xOffset,yOffset

def createPath(CostSurfacefn,costSurfaceArray,startCoord,stopCoord):

    # coordinates to array index
    startCoordX = startCoord[0]
    startCoordY = startCoord[1]
    startIndexX,startIndexY = coord2pixelOffset(CostSurfacefn,startCoordX,startCoordY)

    stopCoordX = stopCoord[0]
    stopCoordY = stopCoord[1]
    stopIndexX,stopIndexY = coord2pixelOffset(CostSurfacefn,stopCoordX,stopCoordY)

    # create path
    indices, weight = route_through_array(costSurfaceArray, (startIndexY,startIndexX), (stopIndexY,stopIndexX),geometric=True,fully_connected=True)
    indices = np.array(indices).T
    path = np.zeros_like(costSurfaceArray)
    path[indices[0], indices[1]] = 1
    return path

def array2raster(newRasterfn,rasterfn,array):
    raster = gdal.Open(rasterfn)
    geotransform = raster.GetGeoTransform()
    originX = geotransform[0]
    originY = geotransform[3]
    pixelWidth = geotransform[1]
    pixelHeight = geotransform[5]
    cols = array.shape[1]
    rows = array.shape[0]

    driver = gdal.GetDriverByName('GTiff')
    outRaster = driver.Create(newRasterfn, cols, rows, 1, gdal.GDT_Byte)
    outRaster.SetGeoTransform((originX, pixelWidth, 0, originY, 0, pixelHeight))
    outband = outRaster.GetRasterBand(1)
    outband.WriteArray(array)
    outRasterSRS = osr.SpatialReference()
    outRasterSRS.ImportFromWkt(raster.GetProjectionRef())
    outRaster.SetProjection(outRasterSRS.ExportToWkt())
    outband.FlushCache()

def main(CostSurfacefn,outputPathfn,startCoord,stopCoord):

    costSurfaceArray = raster2array(CostSurfacefn) # creates array from cost surface raster

    pathArray = createPath(CostSurfacefn,costSurfaceArray,startCoord,stopCoord) # creates path array

    array2raster(outputPathfn,CostSurfacefn,pathArray) # converts path array to raster


if __name__ == "__main__":
    CostSurfacefn = 'CostSurface.tif'
    startCoord = (345387.871,1267855.277)
    stopCoord = (345479.425,1267799.626)
    outputPathfn = 'Path.tif'
    main(CostSurfacefn,outputPathfn,startCoord,stopCoord)
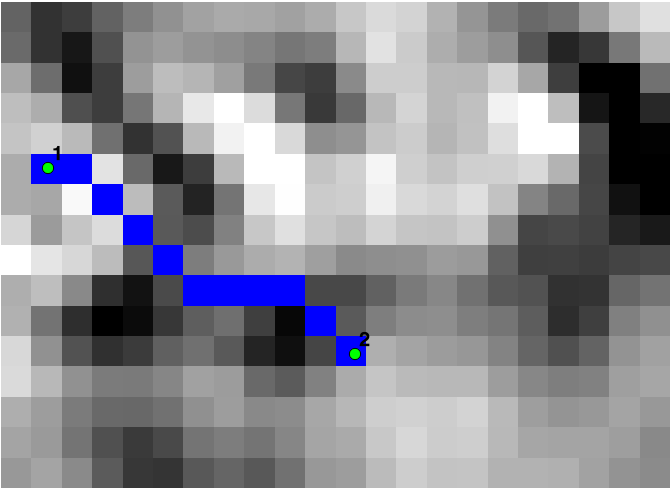
The created cost path between the points.
Replace No Data Value of Raster with new value
This recipe replaces the No Data Value with a new specified value
import gdal, ogr, osr, os
import numpy as np

def raster2array(rasterfn):
    raster = gdal.Open(rasterfn)
    band = raster.GetRasterBand(1)
    return band.ReadAsArray()

def getNoDataValue(rasterfn):
    raster = gdal.Open(rasterfn)
    band = raster.GetRasterBand(1)
    return band.GetNoDataValue()

def array2raster(rasterfn,newRasterfn,array):
    raster = gdal.Open(rasterfn)
    geotransform = raster.GetGeoTransform()
    originX = geotransform[0]
    originY = geotransform[3]
    pixelWidth = geotransform[1]
    pixelHeight = geotransform[5]
    cols = raster.RasterXSize
    rows = raster.RasterYSize

    driver = gdal.GetDriverByName('GTiff')
    outRaster = driver.Create(newRasterfn, cols, rows, 1, gdal.GDT_Float32)
    outRaster.SetGeoTransform((originX, pixelWidth, 0, originY, 0, pixelHeight))
    outband = outRaster.GetRasterBand(1)
    outband.WriteArray(array)
    outRasterSRS = osr.SpatialReference()
    outRasterSRS.ImportFromWkt(raster.GetProjectionRef())
    outRaster.SetProjection(outRasterSRS.ExportToWkt())
    outband.FlushCache()


rasterfn = 'Slope.tif'
newValue = 0
newRasterfn = 'SlopeNew.tif'

# Convert Raster to array
rasterArray = raster2array(rasterfn)

# Get no data value of array
noDataValue = getNoDataValue(rasterfn)

# Updata no data value in array with new value
rasterArray[rasterArray == noDataValue] = newValue

# Write updated array to new raster
array2raster(rasterfn,newRasterfn,rasterArray)